Time series graphs on returns
The following time series graphs illustrate the returns on the investment of earnings-related pension assets since 1997: nominal returns on investments by private-sector pension providers; real return accumulated on investments by private-sector pension providers; and nominal returns on investments by public-sector pension providers.
Content of this page
Nominal returns on investments by private-sector pension providers
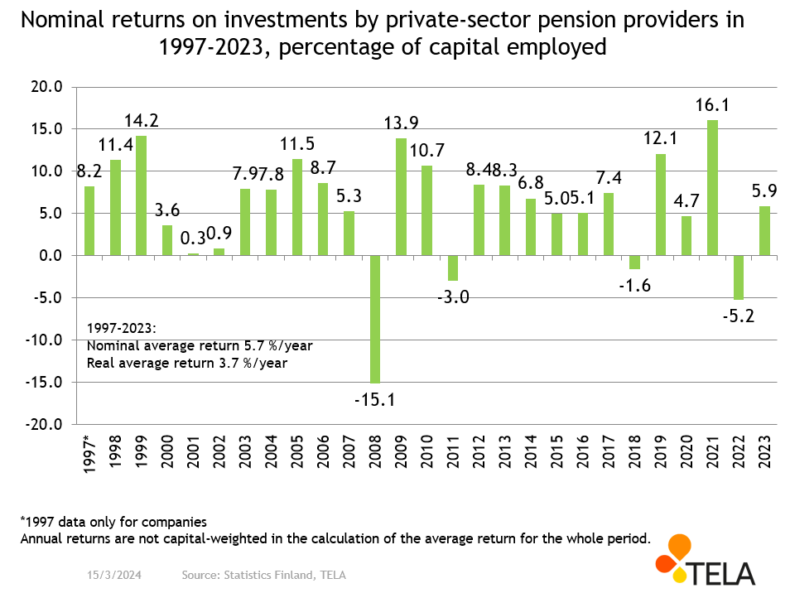
The annual returns on investments made by private-sector pension providers (1997-2023) were positive with the exception of a couple of years. In the early 2000s, returns were positive but modest.
In nominal terms, the average annual return was 5.7 per cent between the years 1997 and 2022, although there were also some years with weaker rates of return. Elimination of the effect of inflation, i.e. the rise in consumer prices, from this nominal return yields the annual real return, which was 3.7 per cent for the same period.
Real return accumulated on investments by private-sector
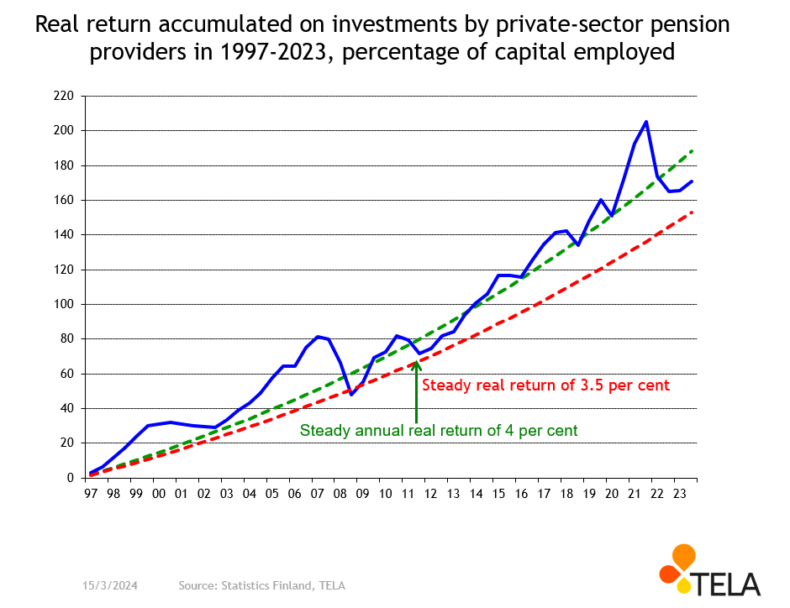
The accumulated real return on investments made by private-sector pension providers describes the annual real returns accumulated each year since 1997. The real rates of return are expressed as percentage of the capital employed.
The blue line on the graph shows the accumulated return. For comparison, the red dotted line shows the situation where a steady real return of 3.5 per cent on the capital employed would have been gained every year. The green dotted line shows the corresponding situation as the red dotted line, but the real rate of return is 4.0 per cent.
Nominal returns on investments by public-sector pension providers
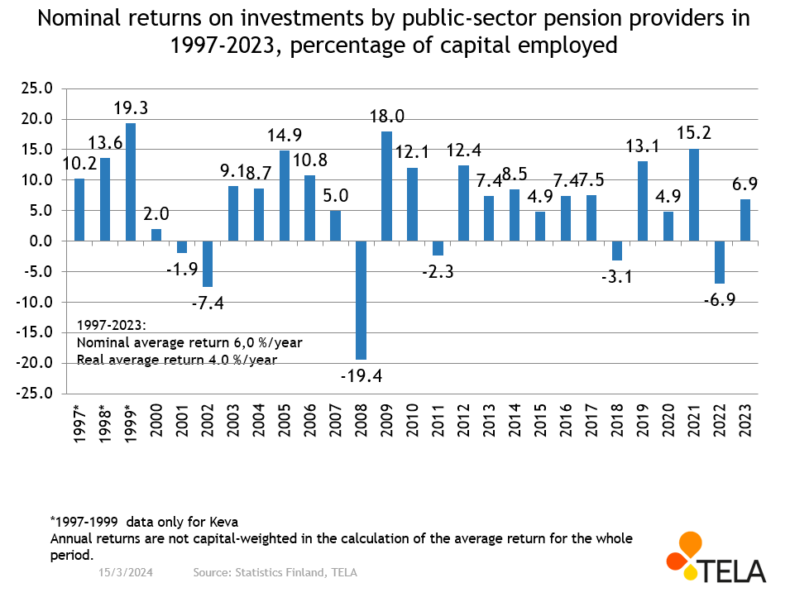
The annual returns on investments made by public-sector pension providers (1997–2023) corresponds close to the returns on investments made by private-sector pension providers. In the public sector, returns vary over a wider range.
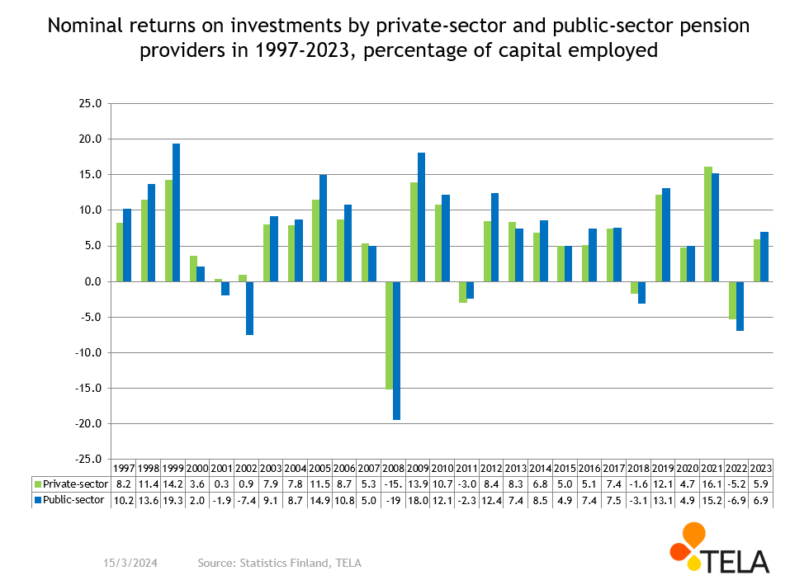
For both groups, the long-term annual returns are very close to each other during the period 1997–2023. During this period, the average annual rate of return for the public-sector pension insurers was 6.0 per cent in nominal terms and 4.0 per cent in real terms.
Nominal returns on investments by private-sector and public-sector pension providers
Time series as a PDF file:
The graphs are updated once a year, during March, when the information on the previous year is available. The graphs can also be downloaded as a PDF file using the link below. If the graphs are used in other contexts, their source must be cited.