Quarterly information on the breakdown of investments and on returns
The six largest earnings-related pension investors publish their interim reports four times a year, always providing information on the breakdown of investments and on returns for each quarter. Based on these interim reports, we update the enclosed quarterly information for each pension provider (known as the risk-return tables), the durations of bonds and the figures for the open currency position.
Content of this page
What do the tables say?
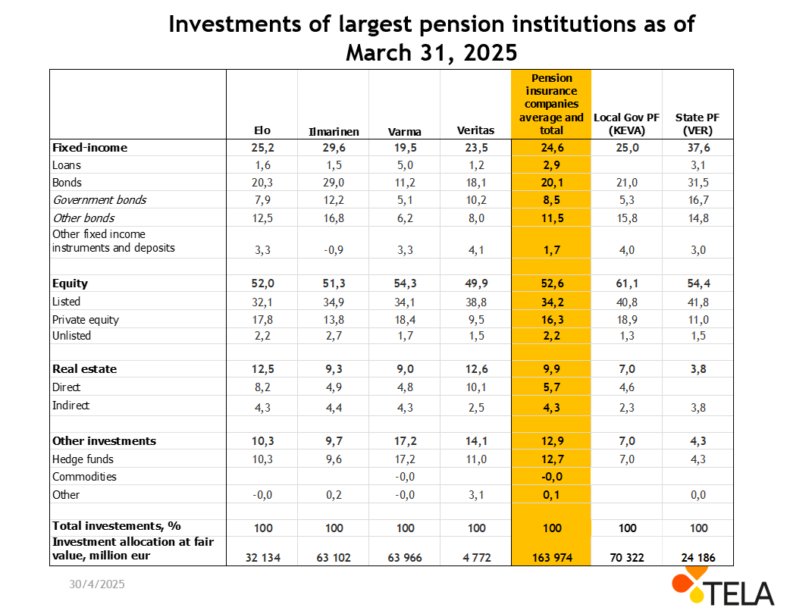
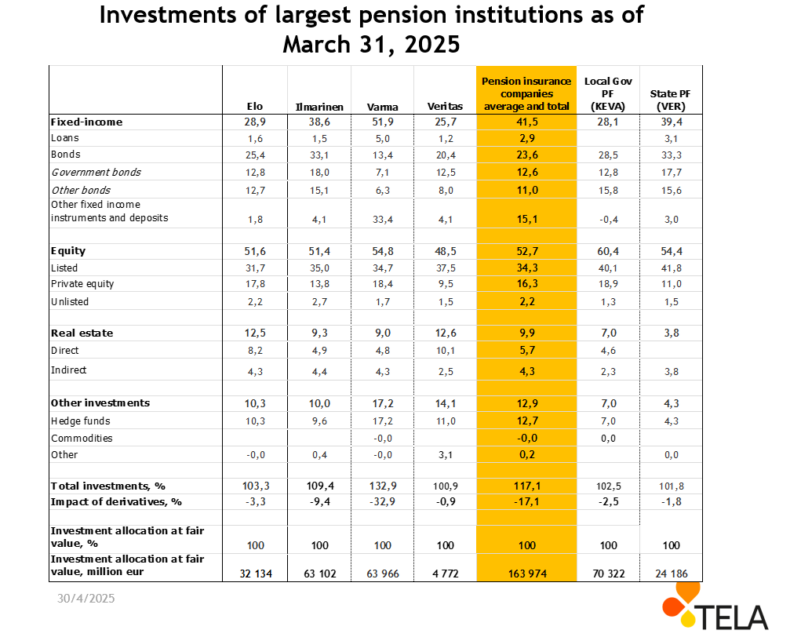
These risk-return tables indicate the breakdown of investments and rates of return as percentages.
The basic asset breakdown shows the combined market value of the investments. The risk-adjusted asset breakdown shows the market value of the investments in a situation where the effect of open derivative positions is taken into account.
It can be said roughly that the basic asset breakdown indicates the breakdown of cash invested among the various assets. The risk-adjusted breakdown describes a situation where the underlying risk position of the basic asset breakdown has been altered by using derivatives.
The fill-in of these tables is based on the guidelines prepared by our investment report group.
We update the tables describing the breakdown of investments and returns on our pages once all data on financial performance have been publicized.
Basic breakdown at market value
Risk breakdown at market value
Rate of return

Notes to the table
1) Weighted averages over companies: the rate of return of a company in an asset class is weighted by the company’s average investment in that asset class at the end of 2024 and end of March 2025.
2) Pension insurance companies are under legal obligation to meet the requirements of solvency regulations. This is not the case for public sector pension providers (Keva, VER). The Department of the Treasury has set an allocation limits for VER.
NOTE: The return figures of the various asset categories are not completely comparable between pension insurers owing to changes caused, for instance, by currencies.
Archive for quarterly information
Interim data for previous years from 2005 onwards can be found in our statistical database. We update the database once all data on financial performance have been publicized.
Durations of the bonds held by the largest authorized pension providers
For the interest rate risk, duration means a modified duration that describes the sensitivity of bond investments to changes in the interest level.
For example, if the duration is 4, it means that the price of a fixed-income investment changes by about 4 per cent of the interest received, i.e. the investor’s required rate of return, changes by one percentage point. In practice, the greater the duration, the greater is also the interest-rate risk.
In certain situations it is also possible, for instance by means of derivatives, to have a negative duration. A negative duration can be used to prepare against rising interest rates. When interest rates rise (fall), the prices of fixed-income investments fall (rise).
Information about the durations of the bonds can be found in our statistical database.
Open currency position
The open currency position describes potential risks affecting the investment portfolios of authorized pension providers, especially in terms of the currency risk. The figure is given as the percentage of the market value of investments.
When calculating open currencies, the first thing to do is to determine, by currency, the content of the investment portfolio quoted in various currencies. Thereafter, the investments are converted into euros, and the hedges taken out on the currencies are deducted separately for each currency. The hedges on various currencies may in part fall short or exceed the original investment denominated in a foreign currency. However, the figures are netted against each other in order to determine the open currency position for the entire portfolio.
If the open currency position in foreign currencies (other than the euro) is, say, 10 per cent of the market value of the entire investment portfolio, this means that 10 per cent of all investments is not hedged by derivatives and is therefore exposed to possible changes in exchange rates.
The greater the open currency position is, the greater are the investment risks when the value of the currency falls. On the other hand, when the value of the foreign currency in relation to the euro rises, the value of the investment also rises correspondingly with respect to the currency component. Thus, an open exchange rate may be either a positive or a negative factor.
Information about the open currency position can be found in our statistical database.
More detailed instructions for calculating the open currency position are available in the guidelines for drawing up a risk-return table (slide no. 12).