Time series graphs on pension assets
The graphs on this page describe the ratio of earnings-related pension assets to the GDP and the distribution of pension insurance companies’ investments in the long run.
Ratio of pension assets to the GDP
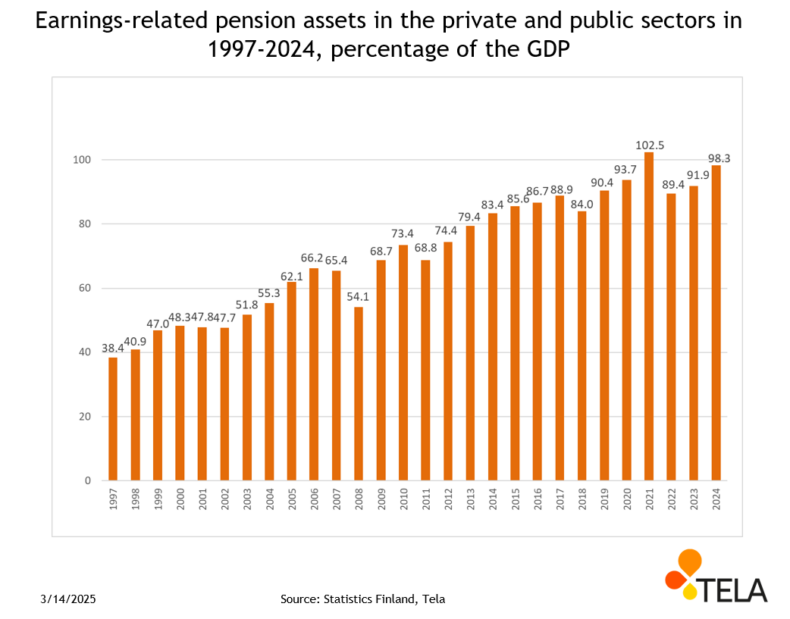
In relation to the gross domestic product, earnings-related pension assets increased from 38 per cent to 102 per cent between 1997 and 2024. This rising trend includes a couple of years when the absolute value of the assets declined because of difficulties on the financial market.
The GDP has usually had a positive trend at the annual level. The GDP shrank only in 2009, when the reverberations of the financial market crisis reached the Finnish real economy. The increase of assets in relation to the GDP is attributable to returns on investments.
Distribution of the pension insurance companies’ investments
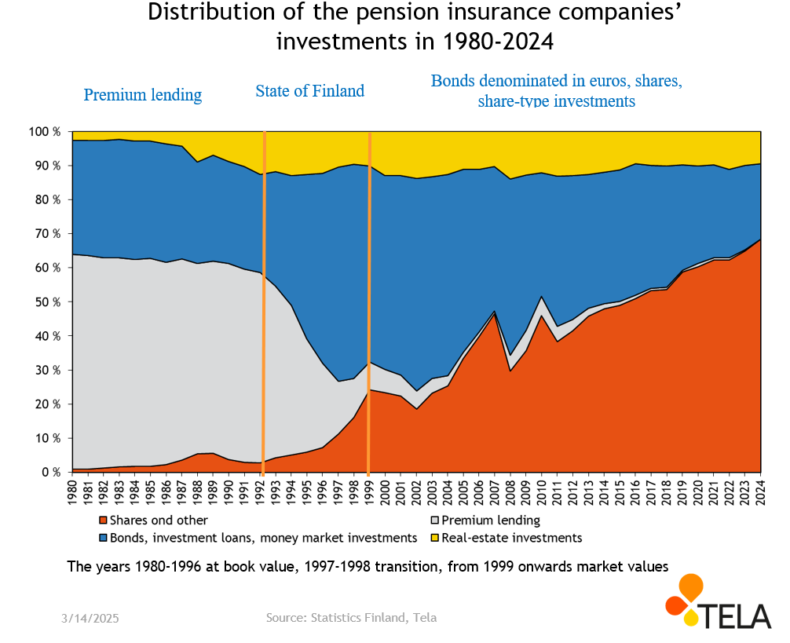
In the 1980s, premium lending was the largest single investment category for pension insurance companies, accounting for nearly two thirds of all investments. The second largest investment category consisted of fixed-income investments other than premium lending. These investments comprised bonds, investment loans and money market investments. The lion’s share of pension insurance companies’ investments, around 80 per cent, were premium loans and investment loans. In the 1990s, the share of sovereign debt instruments issued by the State of Finland rose to over one third of the companies’ investments.
The investment reforms carried out in 1997 and 2007 increased pension insurance companies’ investments in equity. Between the years 2008 and 2023, equity and equity-like instruments accounted for about 30–53 per cent of the companies’ investments.
When referred to investments in equities and equity-like instruments, this means the following categories of investment figures: listed shares (incl. funds); hedge funds; and other investments in equities, which include, for instance, equity investments and investments in unlisted shares.
The earnings-related pension assets in our statistics do not include any other receivables, liabilities or tangible assets entered into the balance sheets of pension providers. The earnings-related pension assets mentioned here refer to assets that can be invested.
The graphs are updated once a year, during March, when the information on the previous year is available. The graphs can also be downloaded as a PDF file using the link below. Figures included in the series of graphs can be borrowed for one’s own use. The source must always be mentioned.