Returns on investments
The funding and investment of earnings-related pension assets generate investment returns for the pension system, which are used to finance earnings-related pensions now being paid. On this page, we have compiled summaries of pension providers’ average annual returns for different time periods.
Content of this page
- Formation of returns
- Rate of return on earnings-related pension investments
- Returns earned by authorized pension providers by the main investment categories
- Returns earned by various pension provider groups
- Returns earned by pension insurance companies
- Returns earned by public sector pension insurers
- Returns earned by company pension funds and industry-wide pension funds
- Return development of shared index
Formation of returns
The returns on earnings-related pension investments consist of two parts: cash returns and changes in the value of invested assets.
- Cash returns include all direct cash flows produced by the investments, such as dividends, interest income and premiums on derivatives. They are always positive.
- Changes in the value of invested assets may be positive or negative. This is because the values of invested assets may rise or fall, depending on the situation.
When the values of invested assets fall sharply, the total returns on investments may turn negative. This happened, for instance, in 2011. Conversely, a rapid increase in the value of invested assets occasionally brings about a considerable rise in the total returns on investments. This happened, for instance, in 2009.
A large proportion of the assets of pension insurers is invested in targets whose value is quoted on the market continuously.
In practice, the greatest value changes take place among shares listed on a stock exchange. Similarly, the quoted values of various interest instruments and bonds vary constantly. However, their value changes are smaller than those of listed shares.
Until such time as the assets are sold, their value changes are deferred. Even then, the value changes must be reported in the pension insurers’ figures for investment returns and solvency calculations.
Rate of return on earnings-related pension investments
The returns on earnings-related pension investments are most commonly followed by means of the rate of return. It is calculated by proportioning the return on the investment in euros to the capital employed during the time when the return was accumulated. The capital employed is calculated by applying the relevant regulations issued by the Financial Supervisory Authority.
The Financial Supervisory Authority’s regulations pertain to periods that do not exceed one year.
The average rate of return over periods longer than one year is calculated applying a recommendation common to the earnings-related pension sector, which is approved by our Investment Reporting Group.
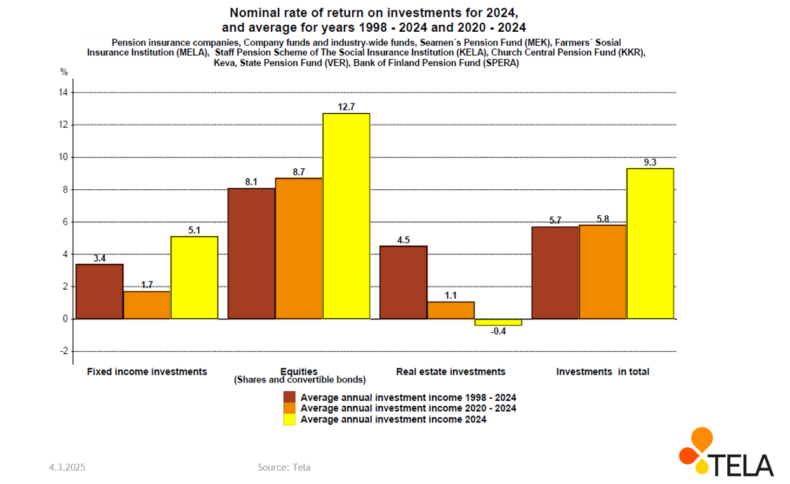
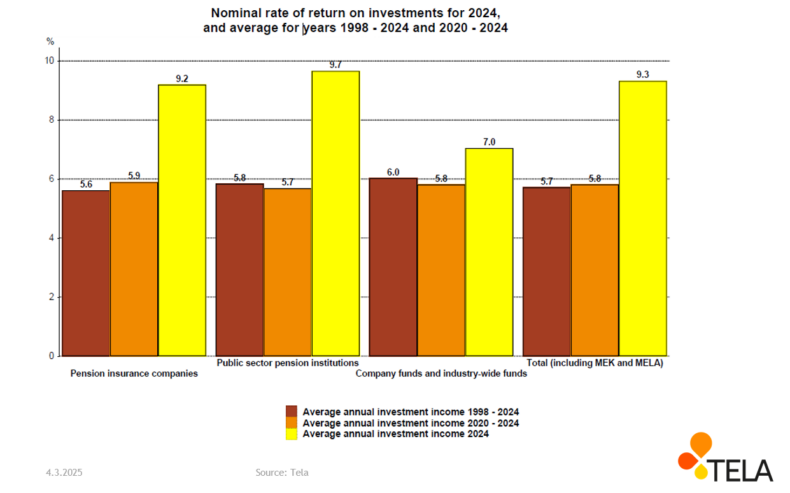
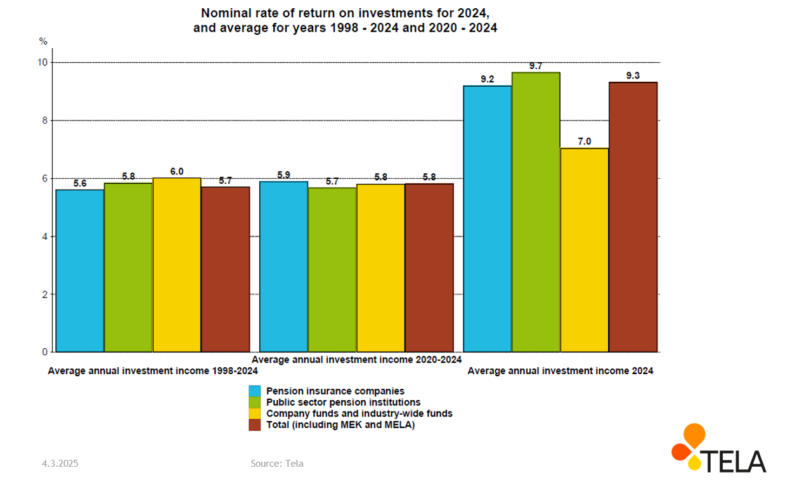
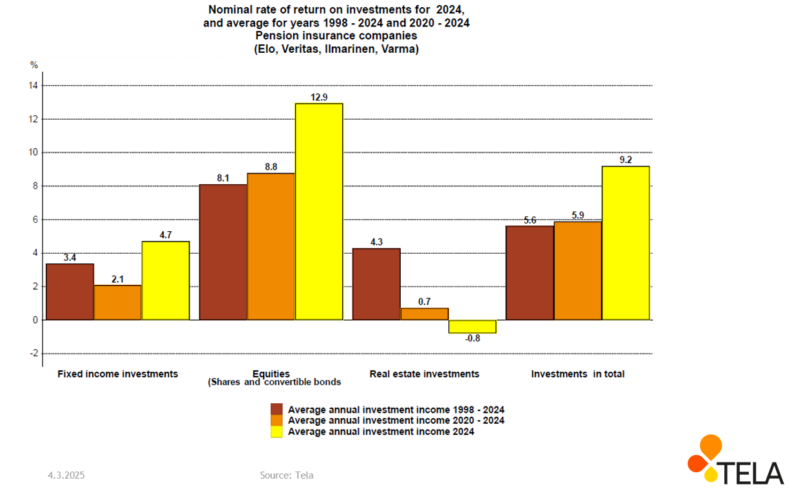
The following graphs illustrate the rates of return for earnings-related pension investments over three periods by pension institution group and by the principal investment type (fixed-income investments, shares and holdings, and real estate investments).
The periods used in the graphs are:
- since 1998, ending with the last full calendar year
- the last five full calendar years
- the most recent information available on the following two:
- semi-annual return for January–June
- annual return for January–December.
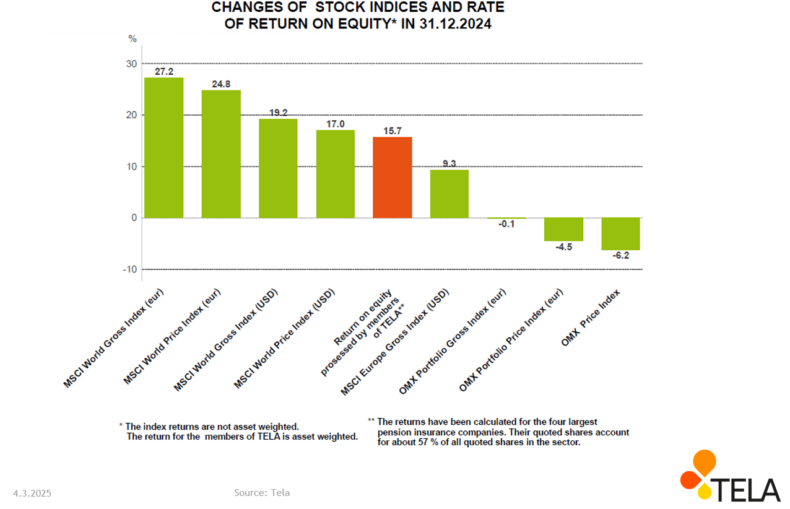
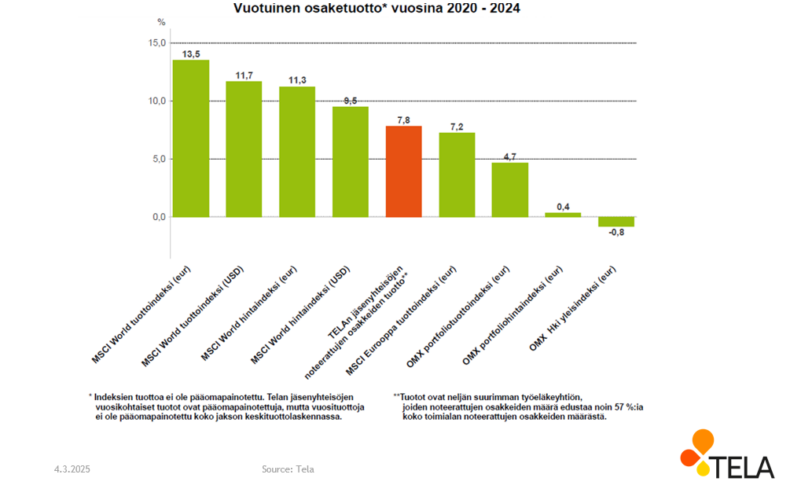
In addition to the returns of our members, we illustrate the general trend of the stock market by means of the return trends shown by some stock indices.
Returns earned by authorized pension providers by the main investment categories

Returns earned by various pension provider groups
Returns earned by pension insurance companies
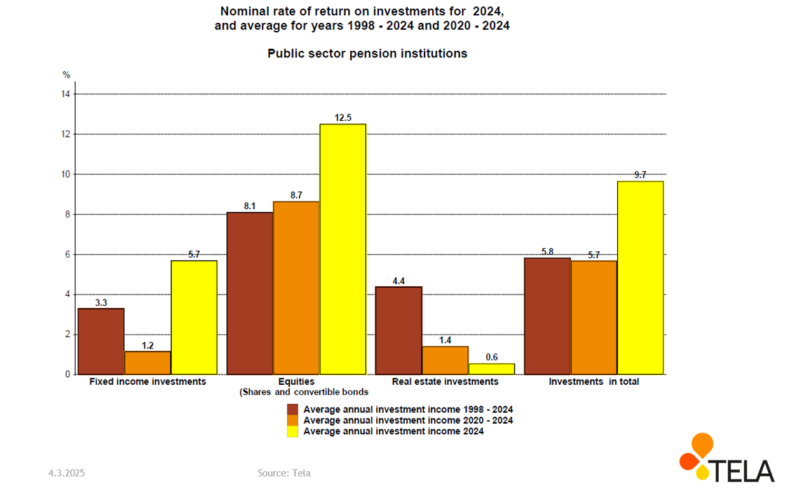
Returns earned by public sector pension insurers
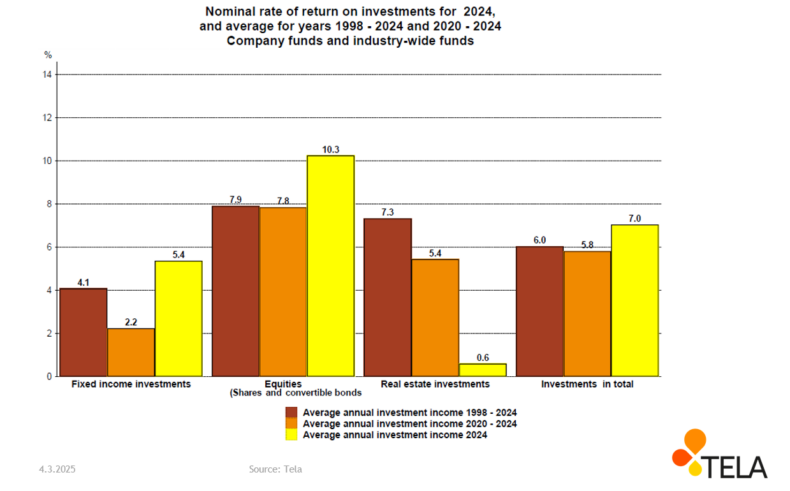
Returns earned by company pension funds and industry-wide pension funds
Return development of shared index
The graphs describing the returns on investments can also be downloaded in PowerPoint format. If the graphs are used in other contexts, their source must be cited.