Amount of pension assets
Authorized pension providers publish information on the results of their investment activities four times a year. Once we have gathered the data of all the players, we draw up a summary of the amount of earnings-related pension assets, their returns and the breakdown of investments, and publish the data on this page. The latest data apply to the situation at the end of March 20245.
Content of this page
Amount and distribution of assets
The total amount of investment assets in the earnings-related pension system is EUR 270 billion at the end of March 2025. During the first quarter, the assets decreased by about EUR 1 billion. Investment assets in the private sector accounted for EUR 171 billion and investment assets in the public sector for EUR 99 billion.
Distribution of investment assets into different investment categories
By investment type, the breakdown of assets was as follows:
- investments in equities and equity-like instruments EUR 157 billion, or 58 per cent [1]
- fixed-income investments EUR 65 billion, or 24 per cent [2]
- real estate investments EUR 23 billion, or 9 per cent
- alternative investments EUR 25 billion, or 9 per cent [3].
[1] Investments in equities and equity-like instruments comprise quoted shares (incl. equity funds) and other investments in equities, such as private equity investments and investments in unquoted shares.
[2] Fixed-income investments include money market investments, bonds and convertible bonds, investment loans and TyEL premium lending.
[3] Alternative investments consist mainly of hedge funds.
If the categories by investment type are compared, for example, to those in the year 2010, the relative share of fixed-income investments shows a longer-term declining trend in the background. At the end of 2010, both equities and equity-like instruments, as well as fixed-income investments, accounted for just over 40 per cent. To the extent allowed by the solvency regulations, earnings-related pension providers have replaced fixed-income investments with other investments having higher return expectations, such as equities, private equity and alternative investments.
Distribution of investment assets by region
By geographical region, the breakdown of assets was as follows:
- assets invested in Finland EUR 51 billion, or 19 per cent
- assets invested in other euro area countries EUR 45 billion, or 17 per cent
- assets invested in non-euro area countries EUR 174 billion, or 64 per cent.
Apart from changes in the value of investments, changes in the relative shares of investments are affected by net flows — that is, the difference between purchases, sales and maturities.
In the longer term, more and more investments have been diversified on the global investment market. For example, at the end of 2010, one third (33.8%) of the assets were invested in Finland, less than one third (28.8%) in other euro area countries and just over one third (37.4%) in non-euro area countries. The shares of domestic and other euro area investments have thus declined, while the share of non-euro area investments has risen sharply.
More detailed information from the statistical database
Our statistical database offers more detailed information on the distribution of pension assets by investment type, region and pension provider group for scrutiny.
Returns on assets
The investment returns for the end of March 2025, in nominal terms, was -0.8 and in real terms, -1.3 per cent (returns minus the effect of inflation).
The returns per investment type for the whole sector, and for the whole year, were as follows:
- average returns on investments in equities: -0.8 per cent in nominal terms and -1,3 per cent in real terms
- average returns on fixed-income investments: 0.3 per cent in nominal terms and -0.2 per cent in real terms
- average returns on real estate investments: 0.5 per cent in nominal terms and 0.0 per cent in real terms
- average returns on alternative investments: 0.6 per cent in nominal terms and 0.1 per cent in real terms.
In view of the financial sustainability of the earnings-related pension system, changes occurring during an individual quarter — or even during a year — are not of major importance. More important is the development of returns in the long run. In the end, pension assets placed into funds increase in step with economic growth and inflation.
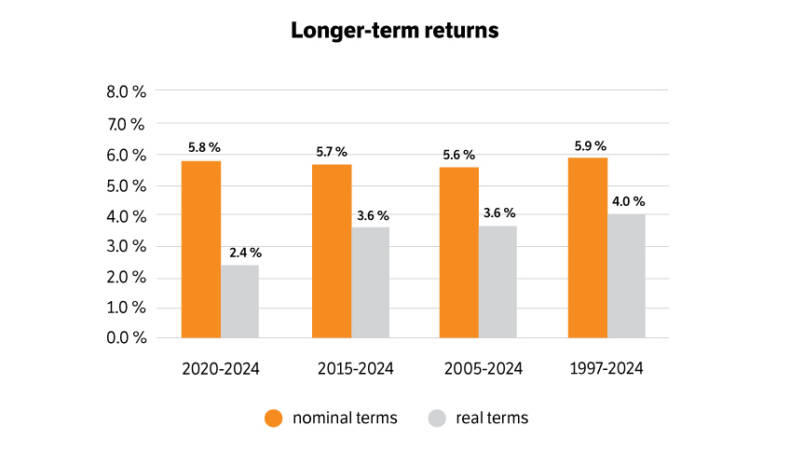
Longer-term returns vary depending on the length of the review period.
- 2020–Q1/2025 (little over 5 years): returns 5.5 per cent in nominal terms and 2.1 per cent in real terms.
- 2015–Q1/2025 (10 years): returns 5.5 per cent in nominal terms and 3.4 per cent in real terms.
- 2005–Q1/2025 (20 years): returns 5.5 per cent in nominal terms and 3.9 per cent in real terms.
- Starting from 1997: returns 5.8 per cent in nominal terms and 3.9 per cent in real terms.
Comparable data on earnings-related pension assets have been available since 1997. Therefore, at the earliest, the most appropriate approach is to start the review at that point in time.
More on the subject
We also comment on the growth of earnings-related pension funds in our accompanying press release:
Role of pension assets in the financing of earnings-related pensions
Earnings-related pensions are mainly financed by pension contributions collected annually. However, the pension system for private-sector employees is partially funded so that some of the pension contributions collected each year are put into funds for future pensions. In the public sector, in turn, some of the annual earnings-related pension contributions were transferred into buffer funds to prepare for future pension expenditure.
The funded pension assets and the returns obtained from them are used for pensions paid every year. For example in 2024, the net sum that was taken from funds and their returns and used for pensions paid during the year was about EUR 5.2 billion. Year by year, pension expenditure grows higher than the income collected through earnings-related pension contributions, and more and more pension euros will be paid from the funds. This has been one of the purposes of creating pension funds.
Although the bulk of annual earnings-related pensions will continue to be paid directly from pension contributions collected during the year, funds and their income are also needed to cover pension entitlements.
Pension entitlements refer to the amount of assets that would be needed to cover the total amount of future pensions accrued up to a certain point in time, taking into account the future income from the assets, if earnings-related pension contributions no longer provided financing for the payment of previously accrued pensions.
The most recent calculations of the Finnish Centre for Pensions describe the situation at the end of 2023, when pension entitlements amounted to approximately EUR 816.7 billion. The funds cover about 30 per cent of this sum.
Basic facts about investment statistics
Authorized pension providers are responsible for investing the statutory earnings-related pension assets. The statistics we compile on pension assets include assets managed by the following actors:
- pension insurance companies
- TyEL funds of company pension funds and industry-wide pension funds (funds for private-sector employees)
- Keva
- State Pension Fund (VER)
- Pension Fund for the Employees of Kela
- Church Pension Fund (KER)
- Bank of Finland’s Pension Fund (SPERA)
- Farmers’ Social Insurance Institution (Mela)
- Seafarers’ Pension Fund (MEK).
The earnings-related pension assets in our statistics do not include any other receivables, liabilities or tangible assets entered into the balance sheets of pension providers. The earnings-related pension assets mentioned here refer to assets that can be invested.
The statistics only cover the statutory earnings-related pension assets placed into funds. The statistics do not include the value of the collective supplementary pension funds managed by industry-wide pension funds and company pension funds, which was approximately EUR 3.7 billion at the end of 2024.
Updating of figures at August-September
The figures presented here describe the amount of earnings-related pension assets at the end of March 2025. The next update of the figures concerns the situation at the end of June 2025. The update is scheduled for between August and September.
Earlier data
Until the second quarter of 2021, we presented the amount of pension assets and financial market developments in a joint “Investment Analysis” summary, which was published at the end of each quarter. Since then, the latest asset data have been compiled on this page.
Press release about the situation at the end of year 2024
Press release about the situation at the end of September 2024
Press release about the situation at the end of June 2024
Press release about the situation at the end of March 2024
Press release about the situation at the end of year 2023: Earnings-related pension assets grew by EUR 13 billion in 2023: pension reform should increase share weighting moderately
Kimmo Koivurinne’s article about the situation at the end of September 2023: Equity investments only source of return in Q3 – how much equity risk is there?
Kimmo Koivurinne’s article about the situation at the end of June 2023: Recipe for pension investments in first half of 2023: diversification, diversification, diversification
Kimmo Koivurinne’s article about the situation at the end of March 2023: Semi-cloudy start to 2023 – pension assets grow by 3bn
Kimmo Koivurinne’s article about the situation at the end of year 2022: Decline in earnings-related pension assets in 2022 does not endanger pension financing
Kimmo Koivurinne’s article about the situation at the end of September 2022: Approaching the autumn in gloom
Kimmo Koivurinne’s article about the situation at the end of June 2022: Grim second quarter overshadowed by war
Kimmo Koivurinne’s article about the situation at the end of March 2022: A bad hand dealt to investors for early 2022
Kimmo Koivurinne’s article about the situation at the end of year 2021: The second coronavirus year favoured equity investments
Kimmo Koivurinne’s article about the situation at the end of Septeber 2021: Inflation and other concerns